

A Mobile Phone Value Depreciation Report has just been released and it contains many interesting findings. How was this done? Well, through 2020-2021, cell phone trade-in site BankMyCell tracked 310 device resale values from multiple vendors, hourly.
Their report shows which smartphones are most likely to bleed resale value by brand, model, and operating system – it’s essential knowledge for consumers looking to leverage the value of their old device in an upgrade.
Here are some key findings from the 2020-2021 Mobile Phone Value Depreciation Report
Take Note: For accuracy, they excluded limited time trade-in/upgrade campaigns from brands & carriers.
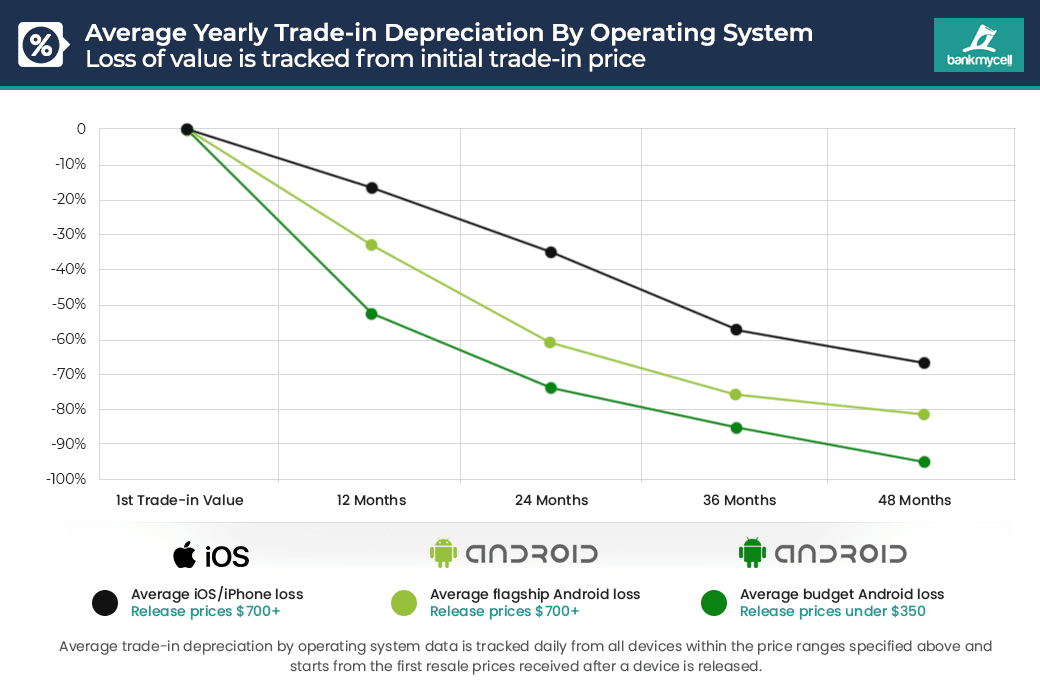
In 0-24 Months, Flagship Android Devices Have Depreciated Double the Rate of iPhones
1. In one year, the current average depreciation of a new iPhone’s trade-in value is 16.70%, compared with Android’s -33.62%.
2. In two years, the current average depreciation of a new iPhone’s trade-in value is -35.47% compared with Android’s -61.50%.
3. After four years, the gap begins to close, with iPhones losing an average of -66.43% of their initial buyback value, compared with Androids -81.11%.
Budget Android Devices Lose an Average Of -52.61% in Year One
On average, Android devices with launch prices of $350 or under lose half their trade-in value in just one year. Owners of popular budget smartphone brands like Samsung, Motorola, LG, HTC, and Google lost an average of -52.61% of their trade-in value in 2019-2020.
1. Budget Android devices retailing for $350 or less will lose an average of -52.61% of their resale value in year one, -73.61% year two, -85.15% year three, and -94.90% by year four.
2. One popular example, the Samsung A50 lost -79.94% of its trade-in value from March 2019 to December 2020.
3. Another example is the Motorola G7 range, which lost up to -74.17% of its trade-in value in 9 months in 2019, then a further -61.97% between Jan-Dec 2020.
iPhone 11 vs. Samsung Galaxy S20 Buyback Prices (Early S21 Warning)
The iPhone 11 range equated to 12.35% of all the trade-ins going through the site in 2020, Samsung’s rival flagship, the Galaxy S20 range, head to head in price retention
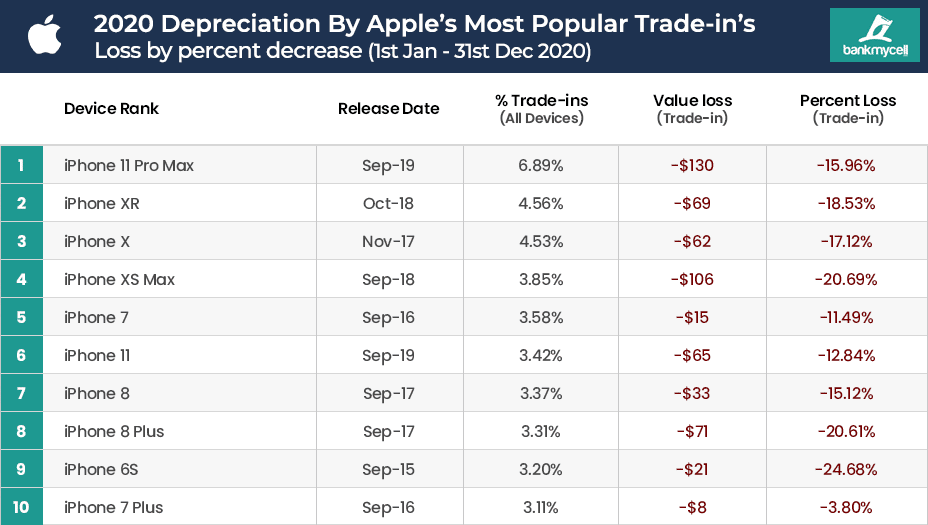
1. iPhone 11 lost 12.84% of its trade-in value in the whole of 2020, compared with the Galaxy S20 losing -34.73% in only nine months since launch.

2. iPhone 11 Pro lost 21.31% of its trade-in value throughout 2020, compared with the Galaxy S20+ losing -30.59% in only nine months since launch.
3. iPhone 11 Pro Max lost 15.96% of its trade-in value in the whole of 2020, compared with the Galaxy S20 Ultra losing -36.30% in only nine months since launch.
Galaxy S20 vs. iPhone 11 Depreciation From New
If we were to look at the depreciation from the devices launch day price, brand new and in a box, not the initial trade-in value above, the data is much more shocking:
1. Nine months after the Samsung Galaxy S20 Ultra release, the buyback price was 64.71% less than its original retail value.
2. By comparison, in the same nine-month timespan from release, the iPhone 11 Pro Max had lost -32.22% from its original retail value.
Apple’s Black Swan: iPhone SE 2020 Resale Value Plummets in 8 Months
It wasn’t all sunshine and roses for Apple, the iPhone SE 2020 did not follow the -16.70% average decline in year one. Like the trends budget Android devices, the iPhone SE 2020 lost an average of -38.32% of its resale price eight months:
1. iPhone SE 2020 (64GB) retailed for $399, had an initial used buyback price for $290, and ended the year on $175 (-39.66%)
2. iPhone SE 2020 (128GB) retailed for $449, had an initial used buyback price for $350, and ended the year on $220 (-37.14%)
3. iPhone SE 2020 (256GB) retailed for $549, had an initial used buyback price for $380, and ended the year on $235 (-37.14%)
Google Pixel 4 Lost -37.35% Trade-In Value & -70.04% Of Its Retail In One Year
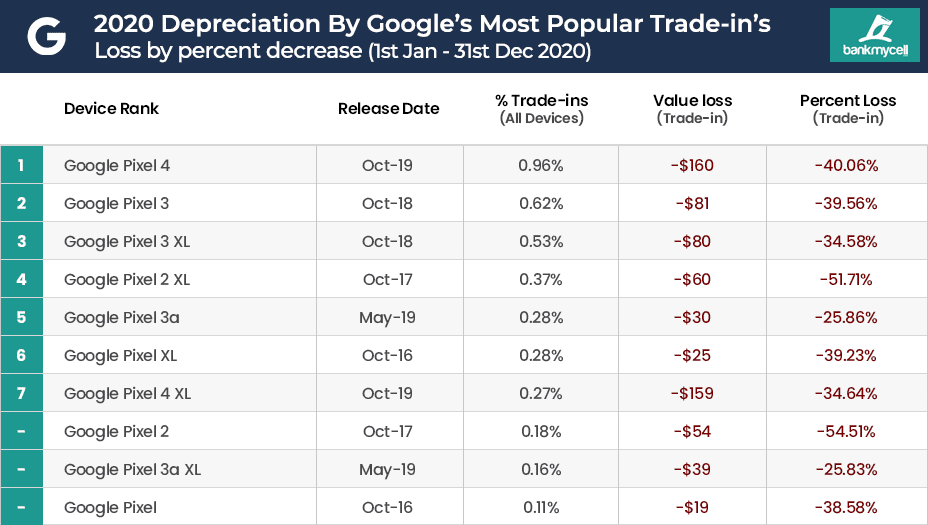
Google Pixel phones appeared in a lot of report lists we ran, like the highest depreciation by price or percentage. Consumers who owned one of the top 10 most traded-in Google Pixel phones in 2020 lost an average of -40.17% of the device’s value in 12 months.
1. In 2020, the average trade-in depreciation of all Google Pixel phones was -38.46% across all models and storage sizes.
2. Google’s Pixel 4 & 4 XL devices lost $154-$163, which is considerable with their initial tradein values ranging between $380 to $490 in Jan 2020
3. As well as making the overall highest value loss list, 2019’s Google Pixel 4 & 4 XL made the top 10 highest mobile phone value depreciation list too, -40.06% Pixel 4, -34.64% Pixel 4 XL.
Upgrade Shock: Motorola, HTC & Sony Worst Phones For Price Retention
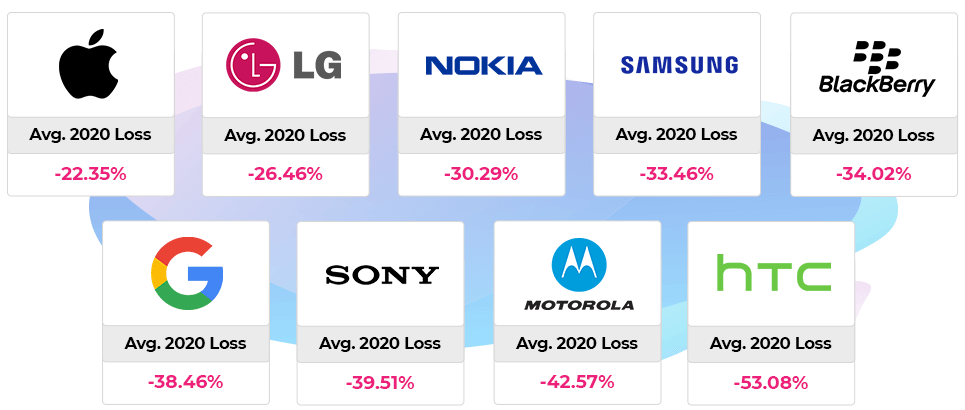
They tracked 310 phone’s depreciation across nine popular phone brands to see which lost the most in 2020. According to the data, the three brands who’s device lost the highest percentage are as follows:
1. HTC smartphone trade-in prices depreciated -53.08% on average between Jan – Dec 2020. The HTC U11 Life (2017) was the highest, depreciating at -81.82%.
2. Motorola smartphone trade-in prices depreciated -42.57% on average between Jan – Dec 2020. The Motorola G7 (2019) was the highest, depreciating at -61.97%.
3. Sony smartphone trade-in prices depreciated -39.51% on average between Jan – Dec 2020. The Sony Xperia XA2 (2018) was the highest, depreciating at -72.22%
Here’s a breakdown of mobile phone value depreciation by mobile phone brand
If find BankMyCell’s Mobile Phone Value Depreciation Report for 2020-21 extremely insightful. Click here if you want to read the full report (which will keep you busy for quite some time).
Watch this space for updates in the Technology category on Running Wolf’s Rant.
Want to promote your business, event, product or service? We get more than 14,000 pageviews a month! Contact us for marketing and advertising options.